



Hospital bed statistics are easy to find and surprisingly hard to use well. For hospitals, distributors and procurement teams, the real value is understanding what those numbers reveal about capacity pressure, staffing limits, ICU readiness, patient safety and the type of bed infrastructure that will be needed next.
This 2026 overview brings together global, European, American, Middle Eastern and product-market data, then turns the numbers into practical context for healthcare planning and medical-equipment purchasing.
Hospital bed statistics in 2026 are less about how many physical beds a health system owns and more about staffed, usable and clinically suitable capacity. This article explains the numbers behind bed density, ICU readiness, regional capacity pressure and the shift toward safer, adjustable and connected medical beds.
In short: hospital capacity should not be judged by physical bed count alone. The more useful questions are whether beds are staffed, operational, department-ready, cleanable, ICU-compatible and supported by reliable maintenance.
Key hospital bed statistics and takeaways for 2026
Hospital capacity should be read through staffed beds, occupancy, ICU readiness and department-level suitability, not physical bed count alone.
Europe is generally moving toward leaner hospital-bed density, while several Middle Eastern markets are expanding and modernizing hospital infrastructure.
The most important hospital-bed buying trends for 2026 are electric adjustment, ICU compatibility, cleanability, patient safety, spare-parts access and lifecycle value.
Smart and connected beds are becoming part of hospital workflow infrastructure, especially where digital capacity management and patient monitoring are priorities.
118 statistics, facts and procurement trends
6 decision-focused categories, not source dumps
2026 planning context for hospitals, buyers and distributors
How to read hospital bed statistics
Hospital bed density
Hospital bed density means the number of hospital beds available per 1,000 people. It is useful for comparing health-system capacity between countries, but it does not show whether those beds are staffed, operational, ICU-ready or suitable for the patients a hospital actually treats.
Methodology and data limitations
This article combines the latest available official health-system data and market data from sources such as OECD, Eurostat, AHA, World Bank / WHO, CDC and selected healthcare market reports. Because hospital-bed statistics are usually published with a delay, a 2026 analysis may rely on source years from 2023, 2024 or 2025. The goal is not to copy raw datasets, but to explain what the numbers mean for hospital capacity planning, ICU readiness and medical-bed procurement.
Data note: official health-system datasets are usually delayed. A 2026 blog can use the latest official data available, but it should clearly state whether the underlying source year is 2023, 2024 or 2025.
Reading tip: the numbers below matter most when they change a planning decision — occupancy strategy, ICU readiness, long-term-care capacity or the specification of the next bed purchase.
How to use the numbers
Use hospital-bed statistics as a starting point, not a final answer. A country can have many beds but poor staffing coverage, while another can operate with fewer beds if outpatient care, day surgery, long-term care and discharge pathways are strong. For procurement teams, the useful question is whether the available beds match the hospital’s clinical workload, cleaning standards, safety requirements and maintenance capacity.
Why hospital bed stats matter in 2026
Hospital-bed statistics are easy to copy and hard to make useful. A strong 2026 guide should do more than repeat public datasets: it should help healthcare executives, procurement teams and project planners understand where bed pressure is coming from, which regions are expanding, and why modern hospital beds are becoming a workflow asset rather than simple furniture.
This guide treats each statistic as a decision point: staffed capacity, occupancy risk, ICU readiness, regional modernization, electric-bed adoption, long-term-care growth and smart-bed demand. For equipment planning, readers can also compare these signals with Optium’s hospital beds and medical equipment range.
Bed logic before bed counts
A useful hospital-bed article should not be a copied dataset. It should explain what the numbers change for planners, buyers and hospital operators.
Definitions and data limitations
Hospital-bed density is normally reported as beds per 1,000 people, which makes countries with very different populations comparable at a planning level. (World Bank / WHO)
OECD hospital-bed comparisons exclude residential long-term-care facilities, which is why hospital and nursing-home capacity should not be mixed casually. (OECD)
The AHA 2026 hospital statistics are based on the 2024 AHA Annual Survey, so a 2026 article should make the reporting lag clear instead of pretending every number is real-time. (AHA)
World Bank metadata warns that hospital-bed counts may not be perfectly comparable across countries because national reporting systems differ. (World Bank / WHO)
Usable capacity, staffing and occupancy
Medicare compliance data treats hospital beds and accessories as a documented medical-necessity category, not a generic furniture purchase. (CMS)
For hospital planners, the right question is not “How many beds?” but “Which beds are staffed, adjustable, cleanable, safe and suitable for the department?” (Optium analysis)
The World Bank hospital-bed series is annual and currently spans 1960–2023, so official global data is useful for trend context rather than daily capacity management. (World Bank / WHO)
A staffed bed is not just a frame: U.S. public-health definitions focus on beds maintained, set up and staffed for inpatient use. (CDC / NCHS)
AHA community hospitals include nonfederal short-term general hospitals and other special hospitals, but exclude facilities not accessible to the general public. (AHA)
An 85% average occupancy threshold is widely used as a warning level because hospitals need slack for emergencies, cleaning, isolation and unexpected admissions. (OECD)
Procurement and real-time readiness
CMS reported a 27.3% improper-payment rate for Medicare hospital beds and accessories in the 2024 reporting period, which makes documentation a procurement issue too. (CMS)
The CDC’s new bed-capacity work shows that real-time availability is becoming as important as annual bed totals. (CDC)
One standard bed model rarely fits emergency, ICU, inpatient, dialysis, bariatric and long-term-care workflows; equipment strategy should follow clinical use cases. (Optium analysis)
JAMA Network Open used 85% occupancy as a conservative shortage threshold in its U.S. bed-capacity scenario analysis. (JAMA Network Open)
What this means: the strongest angle is capacity quality: staffed, department-ready, safe and maintainable beds beat a raw bed-count list.
Global hospital-bed trends
The global picture is not simply “more beds” or “fewer beds.” High-income systems are often reducing bed density while aging, acute complexity and emergency demand increase pressure on the beds that remain.
Global bed-density benchmarks
OECD countries averaged 4.2 hospital beds per 1,000 population in 2023. (OECD)
The EU had almost 2.3 million hospital beds in 2023. (Eurostat)
China was listed at 5.6 hospital beds per 1,000 people in the latest visible World Bank country snapshot. (World Bank)
Japan reported 12.5 hospital beds per 1,000 people in 2023, keeping it close to Korea at the top of the OECD range. (OECD)
The World Bank/WHO indicator includes inpatient beds in public, private, general and specialized hospitals, plus rehabilitation centers in many datasets. (World Bank / WHO)
Brazil’s latest World Bank snapshot placed hospital-bed density around 2.5 beds per 1,000 people. (World Bank)
Mexico, Costa Rica and Sweden were among the lowest-bed-density OECD countries in 2023. (OECD)
Our World in Data’s hospital-bed dataset was updated in 2026 but still draws on WHO/World Bank data with a 1960–2023 data range. (Our World in Data)
High and low bed-density systems
The EU averaged 511 hospital beds per 100,000 people in 2023. (Eurostat News)
Korea reported 12.6 hospital beds per 1,000 people in 2023, one of the highest values among OECD countries. (OECD)
Chile was listed at 1.9 hospital beds per 1,000 people in the latest visible World Bank country snapshot. (World Bank)
Finland recorded the largest OECD decline since 2013, with hospital beds per capita falling by more than 50%. (OECD)
Eurostat notes that shorter stays, outpatient substitution and day-care alternatives help explain why bed density can decline without a simple drop in care access. (Eurostat News)
More than two-thirds of OECD countries reported between 3 and 8 hospital beds per 1,000 people in 2023. (OECD)
Why capacity is shifting by region
EU hospital-bed numbers decreased by about 7% between 2013 and 2023. (Eurostat)
Hospital beds per capita have decreased in nearly all OECD countries since 2013. (OECD)
The United Arab Emirates was listed at 1.87 hospital beds per 1,000 people in a 2022 World Bank-derived snapshot. (World Bank)
Saudi Arabia reported 23.4 hospital beds per 10,000 population in 2024. (Saudi GASTAT)
Qatar’s 2024 health report gave a hospital-bed density of 17 beds per 10,000 population. (Qatar MoPH)
GCC hospital beds reached 127,600 by the end of 2024, with government-owned beds accounting for most capacity. (GCC Statistical Centre)
What this means: a global bed-density comparison only becomes useful when it explains care model, occupancy, staffing and regional investment patterns.
Europe: fewer beds, smarter capacity
Europe is the best example of why a bed-statistics article needs interpretation. The EU has fewer beds than a decade ago, but the bed mix varies sharply between curative, rehabilitative and long-term-care uses.
EU bed-density leaders and overall decline
The EU average fell from 552 hospital beds per 100,000 people in 2013 to 511 in 2023. (Eurostat News)
Bulgaria had the highest EU hospital-bed density in 2023, at 864 beds per 100,000 people. (Eurostat News)
Close to three quarters of EU hospital beds in 2023 were classified as curative-care beds. (Eurostat)
Germany also ranked second by bed density in the EU, with 766 beds per 100,000 people. (Eurostat News)
Romania ranked third by EU bed density, with 728 hospital beds per 100,000 people. (Eurostat News)
Germany had the highest absolute number of EU hospital beds in 2023, with 638,354 beds. (Eurostat)
Austria reported 660 hospital beds per 100,000 people in 2023. (Eurostat News)
Hungary reported 651 hospital beds per 100,000 people in 2023. (Eurostat News)
Low-density countries and curative-care mix
Portugal had one of the highest curative-care shares, with curative beds accounting for 95.3% of hospital beds. (Eurostat)
The EU had seven countries with fewer than 300 hospital beds per 100,000 people in 2023. (Eurostat News)
Sweden had the lowest EU hospital-bed density in the Eurostat News ranking, at 187 beds per 100,000 people. (Eurostat News)
The Netherlands’ curative-care share was 95.0%, showing a very different bed mix from countries with larger long-term-care hospital shares. (Eurostat)
The Netherlands reported 231 hospital beds per 100,000 people in 2023. (Eurostat News)
Denmark reported 233 hospital beds per 100,000 people in 2023. (Eurostat News)
Ireland’s curative-care share was 92.6%. (Eurostat)
Finland reported 260 hospital beds per 100,000 people in 2023. (Eurostat News)
Occupancy, rehabilitation and long-term-care signals
Czechia had the lowest curative-care share among the countries highlighted by Eurostat, at 62.5%. (Eurostat)
Spain reported 288 hospital beds per 100,000 people in 2023. (Eurostat News)
Poland recorded the highest rehabilitative-care share among reporting EU countries, at 30.6% of hospital beds. (Eurostat)
Ireland and Portugal had some of the highest acute-care occupancy rates among EU countries in 2022, both at or above roughly 80%. (OECD Europe)
Ireland reported 289 hospital beds per 100,000 people in 2023. (Eurostat News)
Czechia reported long-term-care beds as 28.8% of its hospital-bed stock, which changes how raw bed density should be interpreted. (Eurostat)
Several EU countries with low occupancy in 2022 still had spare capacity on paper, which shows why utilization matters alongside bed counts. (OECD Europe)
Cyprus reported 298 hospital beds per 100,000 people in 2023. (Eurostat News)
What this means: for European SEO, split future articles by “bed density,” “occupancy pressure,” and “bed type mix” instead of repeating the same country ranking.
Americas: beds vs staffed beds
In the U.S., the central issue is staffed capacity and occupancy. In Latin America, the story is often lower bed density and uneven access. A useful article should connect both to planning and procurement.
U.S. hospital capacity and consolidation
The United States had 6,100 hospitals in the AHA 2026 Fast Facts release. (AHA)
Brazil’s latest visible hospital-bed figure was around 2.47 beds per 1,000 people. (World Bank / OECD)
Mean U.S. hospital occupancy rose from 63.9% in 2009–2019 to 75.3% in the year after the COVID-19 public-health emergency. (JAMA Network Open)
The U.S. had 5,121 community hospitals in the AHA 2026 Fast Facts release. (AHA)
The ten largest U.S. health systems operated about 22% of nonfederal general acute-care beds in 2023. (KFF)
JAMA Network Open found that staffed U.S. hospital beds declined from a 2009–2019 mean of 802,000 to 674,000 in the post-emergency period studied. (JAMA Network Open)
Staffed-bed pressure and future demand
The U.S. had 1,797 rural community hospitals. (AHA)
CDC is working with jurisdictions and hospitals on automated, near-real-time hospital bed capacity data. (CDC)
JAMA Network Open projected U.S. annual hospitalizations rising from about 36.17 million in 2025 to about 40.18 million in 2035 under its aging-population scenario. (JAMA Network Open)
The U.S. had 3,567 community hospitals in a health system. (AHA)
Mexico had 1.0 hospital beds per 1,000 population, below the OECD average of 4.2. (OECD Mexico)
JAMA Network Open found that a 10% increase in staffed bed supply, a 10% reduction in hospitalization rate, or a combination could offset projected aging-related pressure. (JAMA Network Open)
Americas benchmarks and facility-level data
Total staffed beds in all U.S. hospitals were 907,216. (AHA)
Chile had 2.0 hospital beds per 1,000 population in the OECD country note. (OECD Chile)
Staffed beds in U.S. community hospitals totaled 775,297. (AHA)
U.S. community hospital beds per 1,000 residents fell from 2.6 in 2009 to 2.4 in 2019. (CDC / NCHS)
The U.S. had 3,324 urban community hospitals. (AHA)
CMS’s Hospital General Information dataset lists hospitals registered with Medicare, supporting facility-level infrastructure analysis. (CMS)
What this means: for the Americas angle, avoid “U.S. bed count” only. The stronger topic is staffed capacity, aging demand, system consolidation and regional gaps.
Middle East: modernization and expansion
For Optium, this is the commercial sweet spot: Türkiye and the Middle East are not just counting beds; they are investing in hospital campuses, private-sector growth, digital workflows and higher-quality medical furniture.
Türkiye hospital modernization
Türkiye’s health PPP program includes about 30 integrated city-hospital campuses. (Commonwealth Fund)
Saudi Arabia reported 516 hospitals in 2024. (Saudi GASTAT)
Those Turkish city-hospital campuses are described as having a collective capacity of about 43,000 beds. (Commonwealth Fund)
Saudi Arabia reported 23.4 hospital beds per 10,000 population in 2024. (Saudi GASTAT)
HealthTürkiye lists national hospital bed capacity at 270,945 beds. (HealthTürkiye)
Türkiye had 4.2 mental hospital beds per 100,000 people in 2023. (Commonwealth Fund)
Saudi Arabia and GCC capacity expansion
Saudi Arabia reported 36.8 physicians per 10,000 population in 2024. (Saudi GASTAT)
The GCC had approximately 882 hospitals by the end of 2024, an increase of 176 hospitals since 2014. (GCC Statistical Centre)
The GCC is forecast to require 12,317 new hospital beds between 2024 and 2029. (Alpen Capital)
Türkiye had 3.1 hospital beds per 1,000 population, below the OECD average of 4.2. (OECD Türkiye)
HealthTürkiye lists 11,239 health institutions in Türkiye. (HealthTürkiye)
About 9 million people in Türkiye seek mental-health support each year, creating demand for more specialized care capacity. (Commonwealth Fund)
Riyadh Region had 115 hospitals, followed by Makkah Region with 99 hospitals. (Saudi GASTAT)
Qatar and GCC forward demand
Qatar’s Health Report 2024 stated that hospital bed density was 17 beds per 10,000 population. (Qatar MoPH)
Qatar’s open-data portal publishes annual government-hospital bed figures for public-sector capacity analysis. (Qatar Open Data)
GCC hospital beds reached 127,600 by the end of 2024, with 73% in government-owned facilities. (GCC Statistical Centre)
Alpen Capital forecasts GCC collective bed capacity reaching 140,572 by 2029. (Alpen Capital)
What this means: for Optium, the regional content angle should be “modern hospital environments” rather than a simple “GCC is adding beds” story.
Hospital bed buying trends in 2026
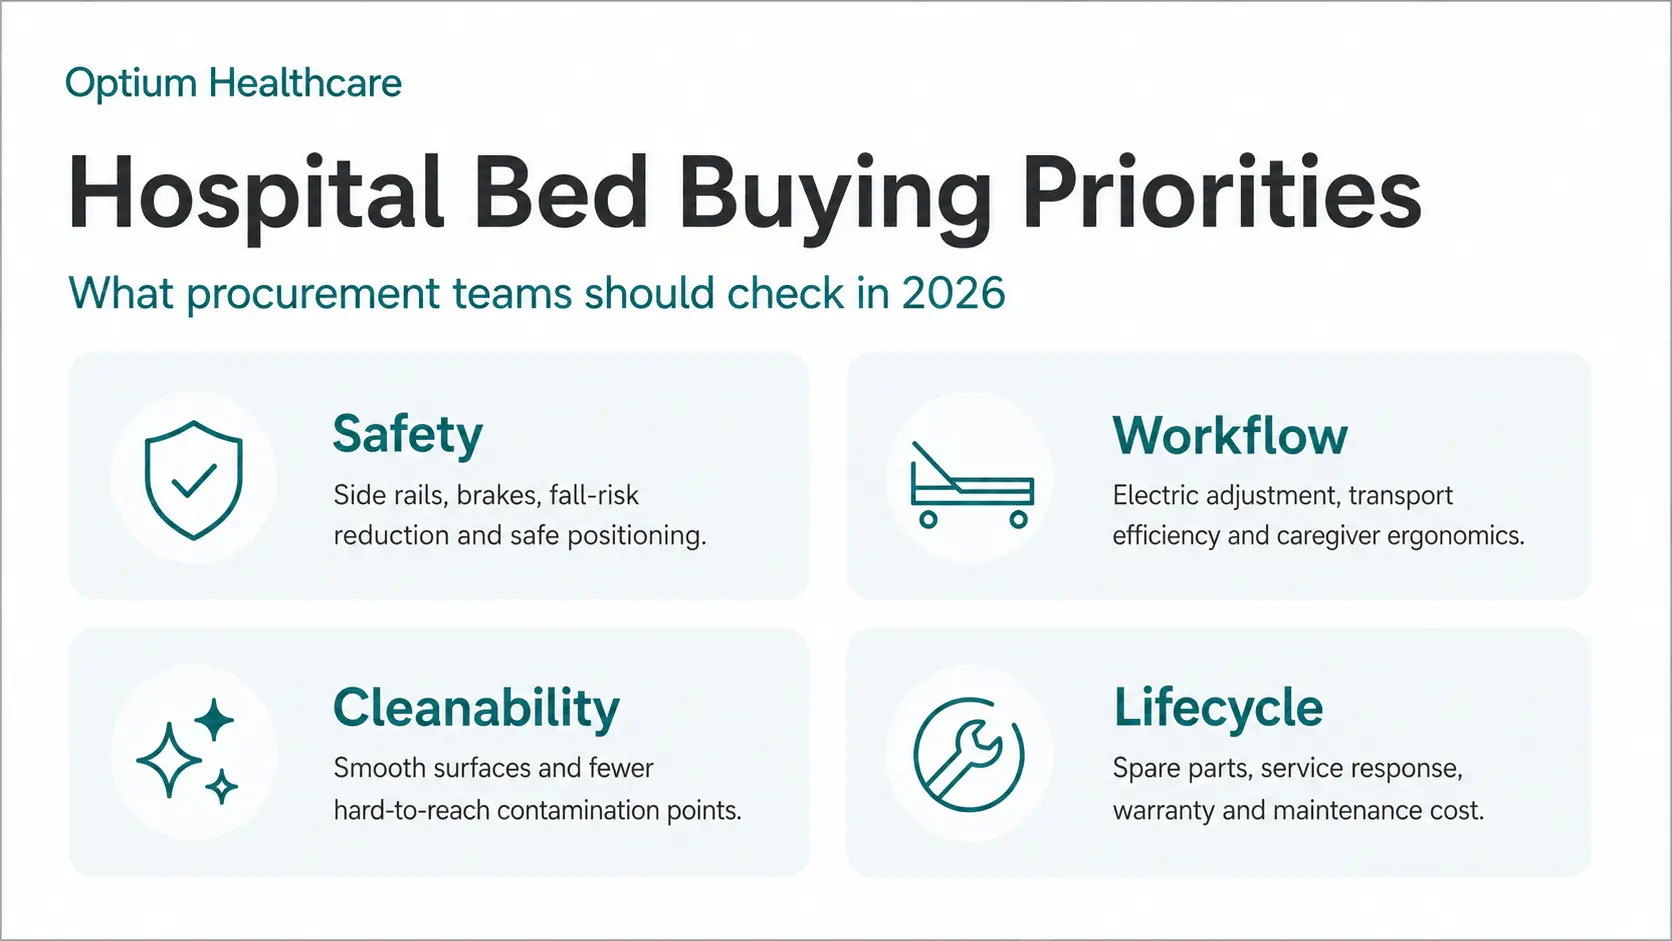
The statistics become useful for a medical-equipment brand when they translate into product needs: ICU compatibility, electric adjustment, infection-control surfaces, documentation, spare parts and after-sales support. For technical comparison, Optium’s product catalogues and documentation can support the next step after reading the data.
Market size and investment direction
The hospital beds market was valued at about USD 4.8 billion in 2025. (Mordor Intelligence)
ICU capacity averaged 17 ICU beds per 100,000 population across 31 OECD countries in 2023. (OECD)
The smart hospital beds market was valued at USD 523.7 million in 2024. (Global Market Insights)
The hospital beds market is forecast to grow at a 6.99% CAGR from 2025 to 2030. (Mordor Intelligence)
ICU readiness, safety and infection control
Czechia and Estonia had around 40 or more ICU beds per 100,000 population in 2023. (OECD)
ICU-ready beds should be evaluated for height range, brake system, side rails, accessory compatibility, mattress platform and safe patient handling. (Optium analysis)
Semi-electric medical beds are forecast to expand at a 7.05% CAGR through 2031. (Mordor Intelligence)
New Zealand and Sweden had below 5 ICU beds per 100,000 population in 2023. (OECD)
The smart hospital beds market is estimated at USD 544.8 million in 2025. (Global Market Insights)
Infection-control performance depends on smooth surfaces, cleanable materials and bed designs that reduce hard-to-reach contamination points. (Optium analysis)
Smart-bed and long-term-care growth
Intensive-care beds are projected to expand at a 7.22% CAGR through 2031 in Mordor’s medical beds segmentation. (Mordor Intelligence)
The smart hospital beds market is projected to reach USD 1 billion by 2034. (Global Market Insights)
The hospital beds market is forecast to reach USD 6.74 billion by 2030. (Mordor Intelligence)
Total cost of ownership should include motors, control units, castors, spare parts, service response time, training and warranty support. (Optium analysis)
Long-term care facilities are projected to be among the fastest-growing medical-bed end-user segments, at 8.12% CAGR through 2031. (Mordor Intelligence)
Smart hospital beds are projected to grow at a 7.3% CAGR from 2025 to 2034. (Global Market Insights)
Procurement, documentation and lifecycle value
Electric medical beds held 44.72% share by technology in Mordor’s medical beds market view for 2025. (Mordor Intelligence)
The more connected hospitals become, the more beds shift from passive furniture to workflow infrastructure. (Optium analysis)
Hospitals and healthcare facilities remained the largest medical-bed customer group, with a 51.84% share in Mordor’s 2025 view. (Mordor Intelligence)
IoT, AI, patient-centered care and hospital automation are named as adoption drivers for smart hospital beds. (Global Market Insights)
General medical beds led Mordor’s product segmentation with a 28.02% revenue share in 2025. (Mordor Intelligence)
CMS found that insufficient documentation accounted for 82.6% of improper payments for Medicare hospital beds and accessories in the 2024 reporting period. (CMS)
CDC’s bed-capacity initiative points toward automated data exchange as a future capacity-management requirement. (CDC)
AHA says its data set is provided by over 6,200 hospitals and 400 health systems, showing how granular hospital planning has become. (AHA)
For 2026 procurement, the winning bed specification is a balance of patient comfort, caregiver efficiency, safety, maintenance and lifecycle value. (Optium analysis)
What this means: this is where Optium can differentiate: the article should move readers from public statistics to better equipment decisions.
Hospital bed statistics FAQ
What is hospital bed density?
Hospital bed density is the number of hospital beds available per 1,000 people. It helps compare health-system capacity between countries, but it does not show whether those beds are staffed, operational or clinically suitable.
Why not just publish a list of hospital bed density by country?
Because readers can get a raw table from OECD, Eurostat or World Bank. The value of a brand article is explaining what the numbers mean for capacity planning, equipment choice, staff efficiency and patient safety.
Is a high bed count always a good sign?
No. High bed density may support surge capacity, but it can also reflect longer stays or less outpatient substitution. Low bed density may work if occupancy, staffing, home care and day-care pathways are strong.
What is the difference between a bed and a staffed bed?
A physical bed is equipment. A staffed bed is usable clinical capacity because the hospital has the staff, processes and support systems needed to admit and care for a patient safely.
What should procurement teams focus on in 2026?
They should evaluate motor configuration, height range, safety rails, brake systems, cleanability, ICU compatibility, accessories, spare parts, service response, warranty and long-term maintenance cost. Optium’s product range and catalogue page are natural next steps for technical review.